These are the demographics of the respondents to the survey.
There were 507 total respondents. Here’s how they break down.
Note that these numbers are not indicative of where digital agencies are located overall, but just this survey’s respondents.
Credo’s customer base and audience are very North America-focused (as is our business).
From the data, it’s clear that our partner Teamwork’s customer base is a bit more international, though still largely focused on the United States.
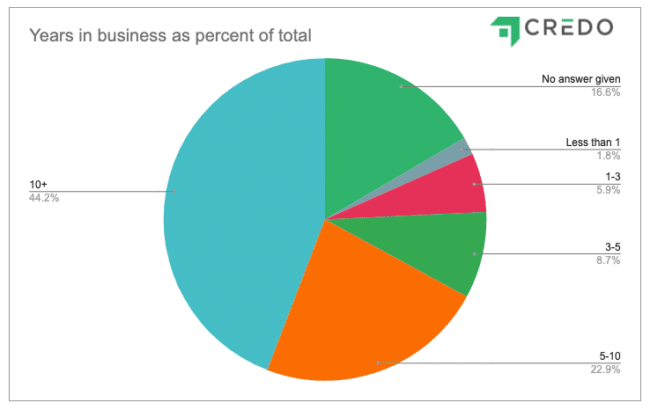 What we learn from this is that this survey skews towards more experienced and therefore higher-priced digital agencies.
While other pricing surveys have focused on freelancers (and often contributed to the commodification of the industry and driving pricing down instead of up), this survey focuses on highly skilled experts.
It includes those agencies that have stood the test of time.
It is important to note that other pricing surveys are more focused on freelancers (solo practitioners with fewer years of experience than consultants who focus on “services” for clients) across the world.
While this is great for a global view, it unfairly skews numbers towards areas of the world where labor can be had for cheaper, and disadvantages senior consultants and expert firms in the United States and other countries with a higher cost of living.
Our survey is more focused on these countries as they are also the countries that Credo serves.
Offshoring to a cheaper country has a time and place, but Credo focuses on the top vetted marketing providers we can find. You can see our vetting process here.
This year’s survey was more international in the past, though 82% of respondents came from just 4 countries and there were only 5 respondents from the continent of Africa.
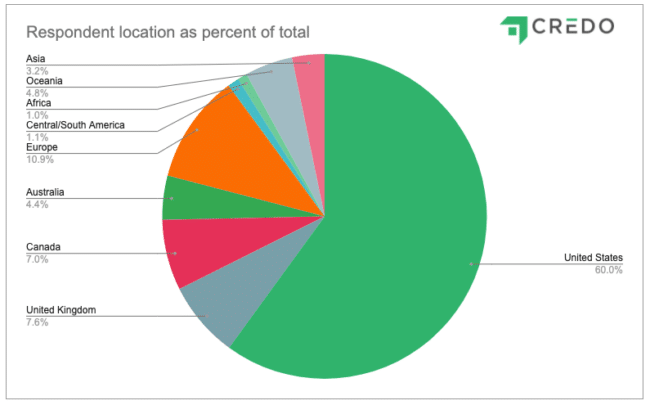
The takeaway from this data is that the pricing displayed in the following report is mostly focused on English-speaking countries.
82.02% of respondents are from the top 4 countries and all of these countries are predominantly English speaking.
An important part of having an accurate pricing survey is having enough respondents from different groups to be able to draw clear conclusions.
We aim for a representative sample of respondents.
We fully admit that while 500 respondents are not enough to declare statistical significance, we do consider it enough to draw good conclusions that will accurately inform your decision-making.
Here is the breakdown across respondent company sizes:
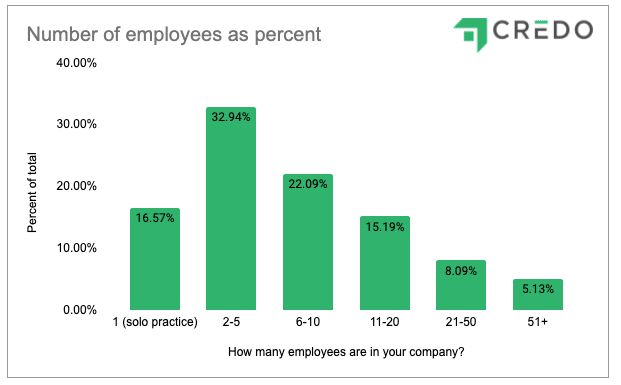
What we can take from this is that the majority of respondents are agencies (2+ people full-time) and thus the majority of the data presented in this report will be focused on digital agencies.
Data on solo consultants are presented throughout this report, and as you see that data, keep in mind that there were only 84 solo consultant respondents to the survey.
This page last updated on March 7, 2023 by John Doherty
Drive results for your marketing needs with the Credo network. Get started today (it's free and there is no obligation)!
 Loading...